Is the Approach Game Making a Comeback?
If you’ve been tuning into the 2020 French Open and found yourself saying, ‘man, seems like guys are going to the net a lot’, you wouldn’t be wrong. So far, the approach rate at RG this year is an average of 19 per 100 points compared to 17 per 100 points in 2019 and 15 per 100 points in 2017 and 2018. It may seem small, but an upward shift of this size requires multiple players to be going to the net at an above average rate. So who might be driving this shift? And is the shift more than a one-off?
We all know that today’s tennis is a baseliner’s game. The widespread adoption of synthetic strings in the late 1990s and a general slowing of the pace of play have both been major factors behind the decrease in approach-focused play strategies like serve-and-volley.
Sure, some active guys have always bucked that trend (think Feliciano Lopez and Mischa Zverev). But they have been the exception. As much as coaches might urge their players to go to net (yes, Apostolos, we are talking to you), approaching is a scary proposition in the context of the modern game and most players haven’t been able to pull it off successfully.
But could things be changing?
Watching the matches at the 2020 Roland Garros has certainly made me wonder. In multiple matches, next generation players like Denis Shapovalov, Alexander Bublik, Jannik Sinner were approaching at rates close to 1 in every 3 points. It wasn’t just that all players seemed to be going to the net more but that players I wouldn’t expect were.
Still, impressions from a handful of matches don’t mean much. I wanted to test my impression. To do that, I need some way to quantify the type of player we might expect to play an approach game and contrast that with the players going to net in recent majors.
So who is the type of player that should go to net? Players who aren’t comfortable rallying from the baseline would be top candidates. This would suggest big guys with big serves and limited agility. At a minimum then, a model of approach rate should account for player height, serve ability and rally ability.
Other than height (assuming the heights reported in player bios are true), it isn’t obvious how to best measure of serve and rally ability would be. As a ver basic start, I will focus on what is readily available for most matches: ace rate (aces to total points served) and return points won. Below is the distribution of height, ace rate, and return points won along with approach rate (approaches out of total points won). Sadly, outside of the MCP, approach stats aren’t regularly tallied for matches outside of the Grand Slams so I am only including slam matches between 2005 and 2015.
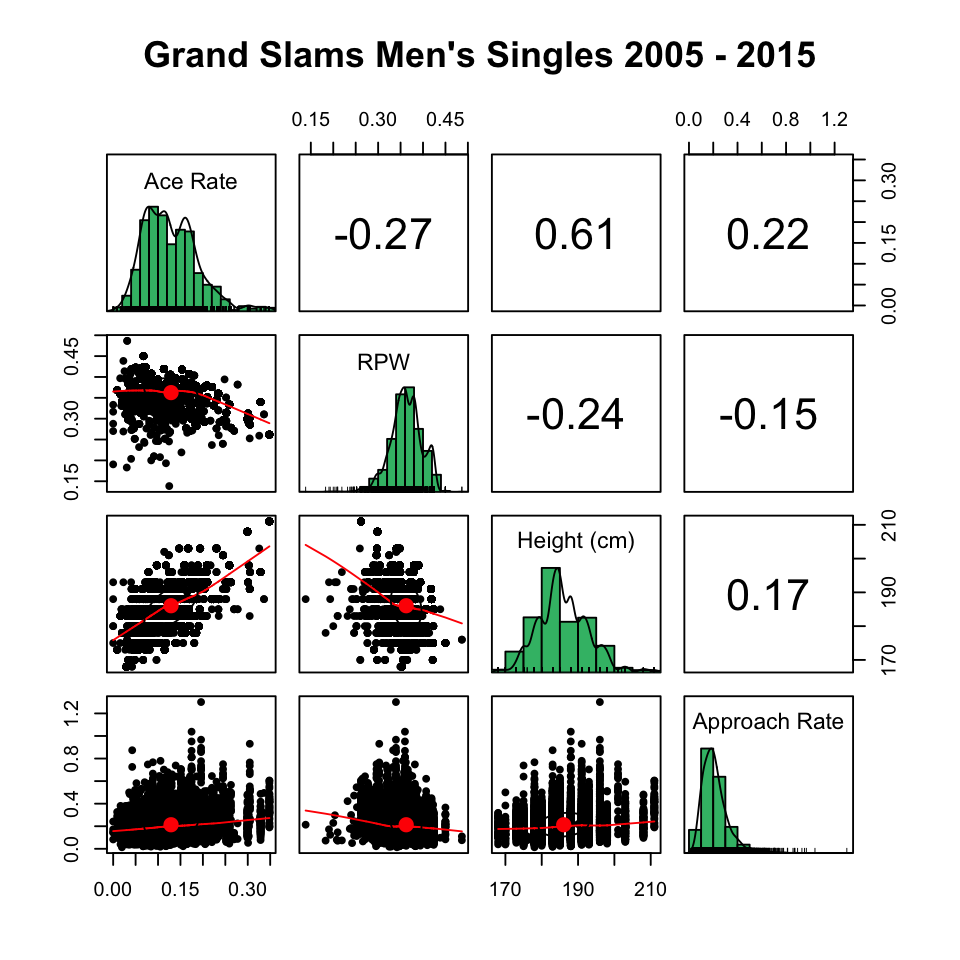
The main takeaway from above is that, if height, serve power, and rally ability (to the extent we are getting at them here), are related to a player’s tendency to approach, the nature of that relationship is complicated. We don’t see approach rate increasing strongly with a player’s serve strength, for example.
Now, it may be that these just aren’t good feature for approach style. On the other hand, it might be that the approach tendency is non-linearly related to these factors. This would be true, for example, if greater height correlates with a better net game only up to some point, with freakishly tall players being better off to defend from the baseline. I don’t know that to be true, but it would be the kind of scenario to induce a “non-linear” relationship with approach rate.
When can use a GAM model to explore that possibility. Let’s call a player’s approach rate in a given match, $\lambda$, and use $h$, $s$ and $r$ to index effects for height, ace rate, and return ability, taking the averages of each of those over all of a player’s matches in order to capture their average abilities. I am going to consider the following GAM model,
$$ \lambda = f(\theta_h, \theta_s, \theta_r) + \alpha_t $$
where $f(.)$ is a trivariate smoothing function using regression plate functions. The $\alpha_t$ is a a tournament-specific intercept term.
Fitting this model to Grand Slam matches between 2005 and 2015, what will serve as a historical baseline for approach tendencies, the above model explains 43% of the deviance in approach frequency. That is much better than the pairwise correlations above suggested, which would imply that non-linear effects are at play.
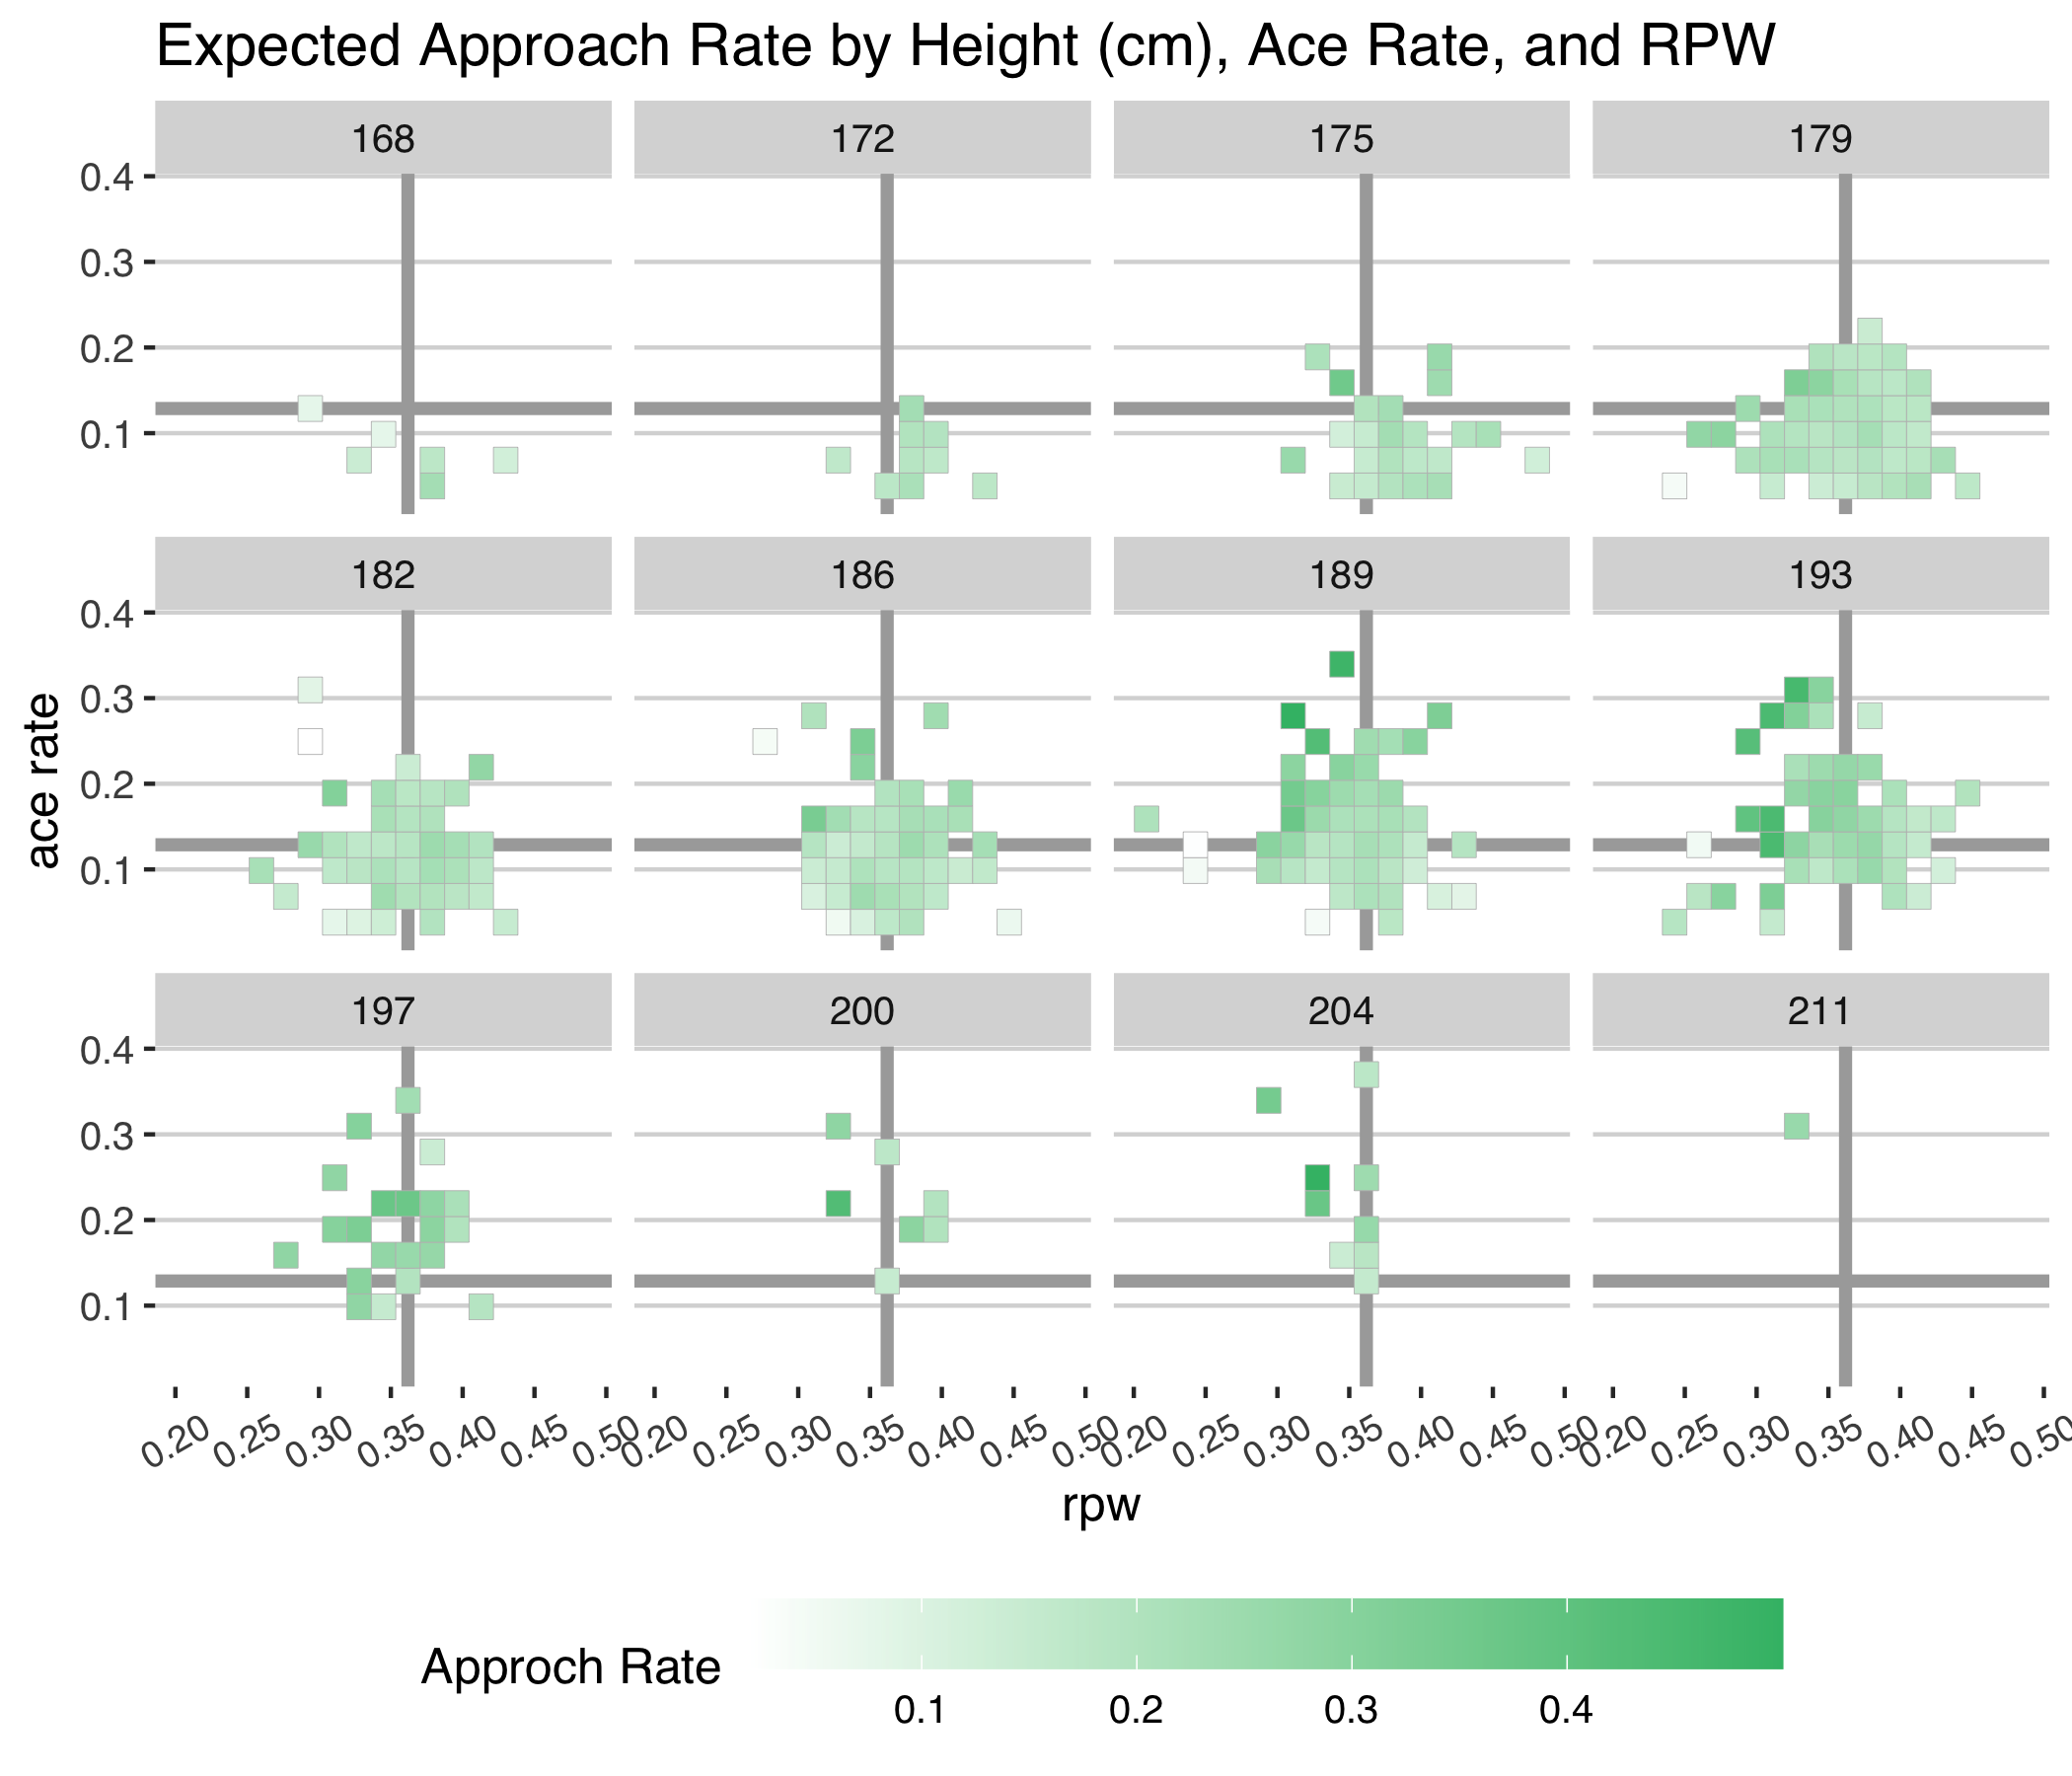
We can confirm that below by looking at the predicted approach rate for different player types. This shows a clear cluster for players around 188 cm and taller with bigger than average serves and below average return ability. But there does appear to be a limit to that trend as we see players of 200 cm height and taller with lower approach rates in general.
Its a pretty basic model for approach behavior. Still it does capture some basic tendencies and, in doing so, can go some way in picking out the players we would, given patterns between 2005 and 2015, expect to be the most likely to go for an approach game. Applying this model to slam matches in the past 5 years, we can compare observed rates to the predicted rates, according to the height, serve power, and rally ability of the most recent slam players.
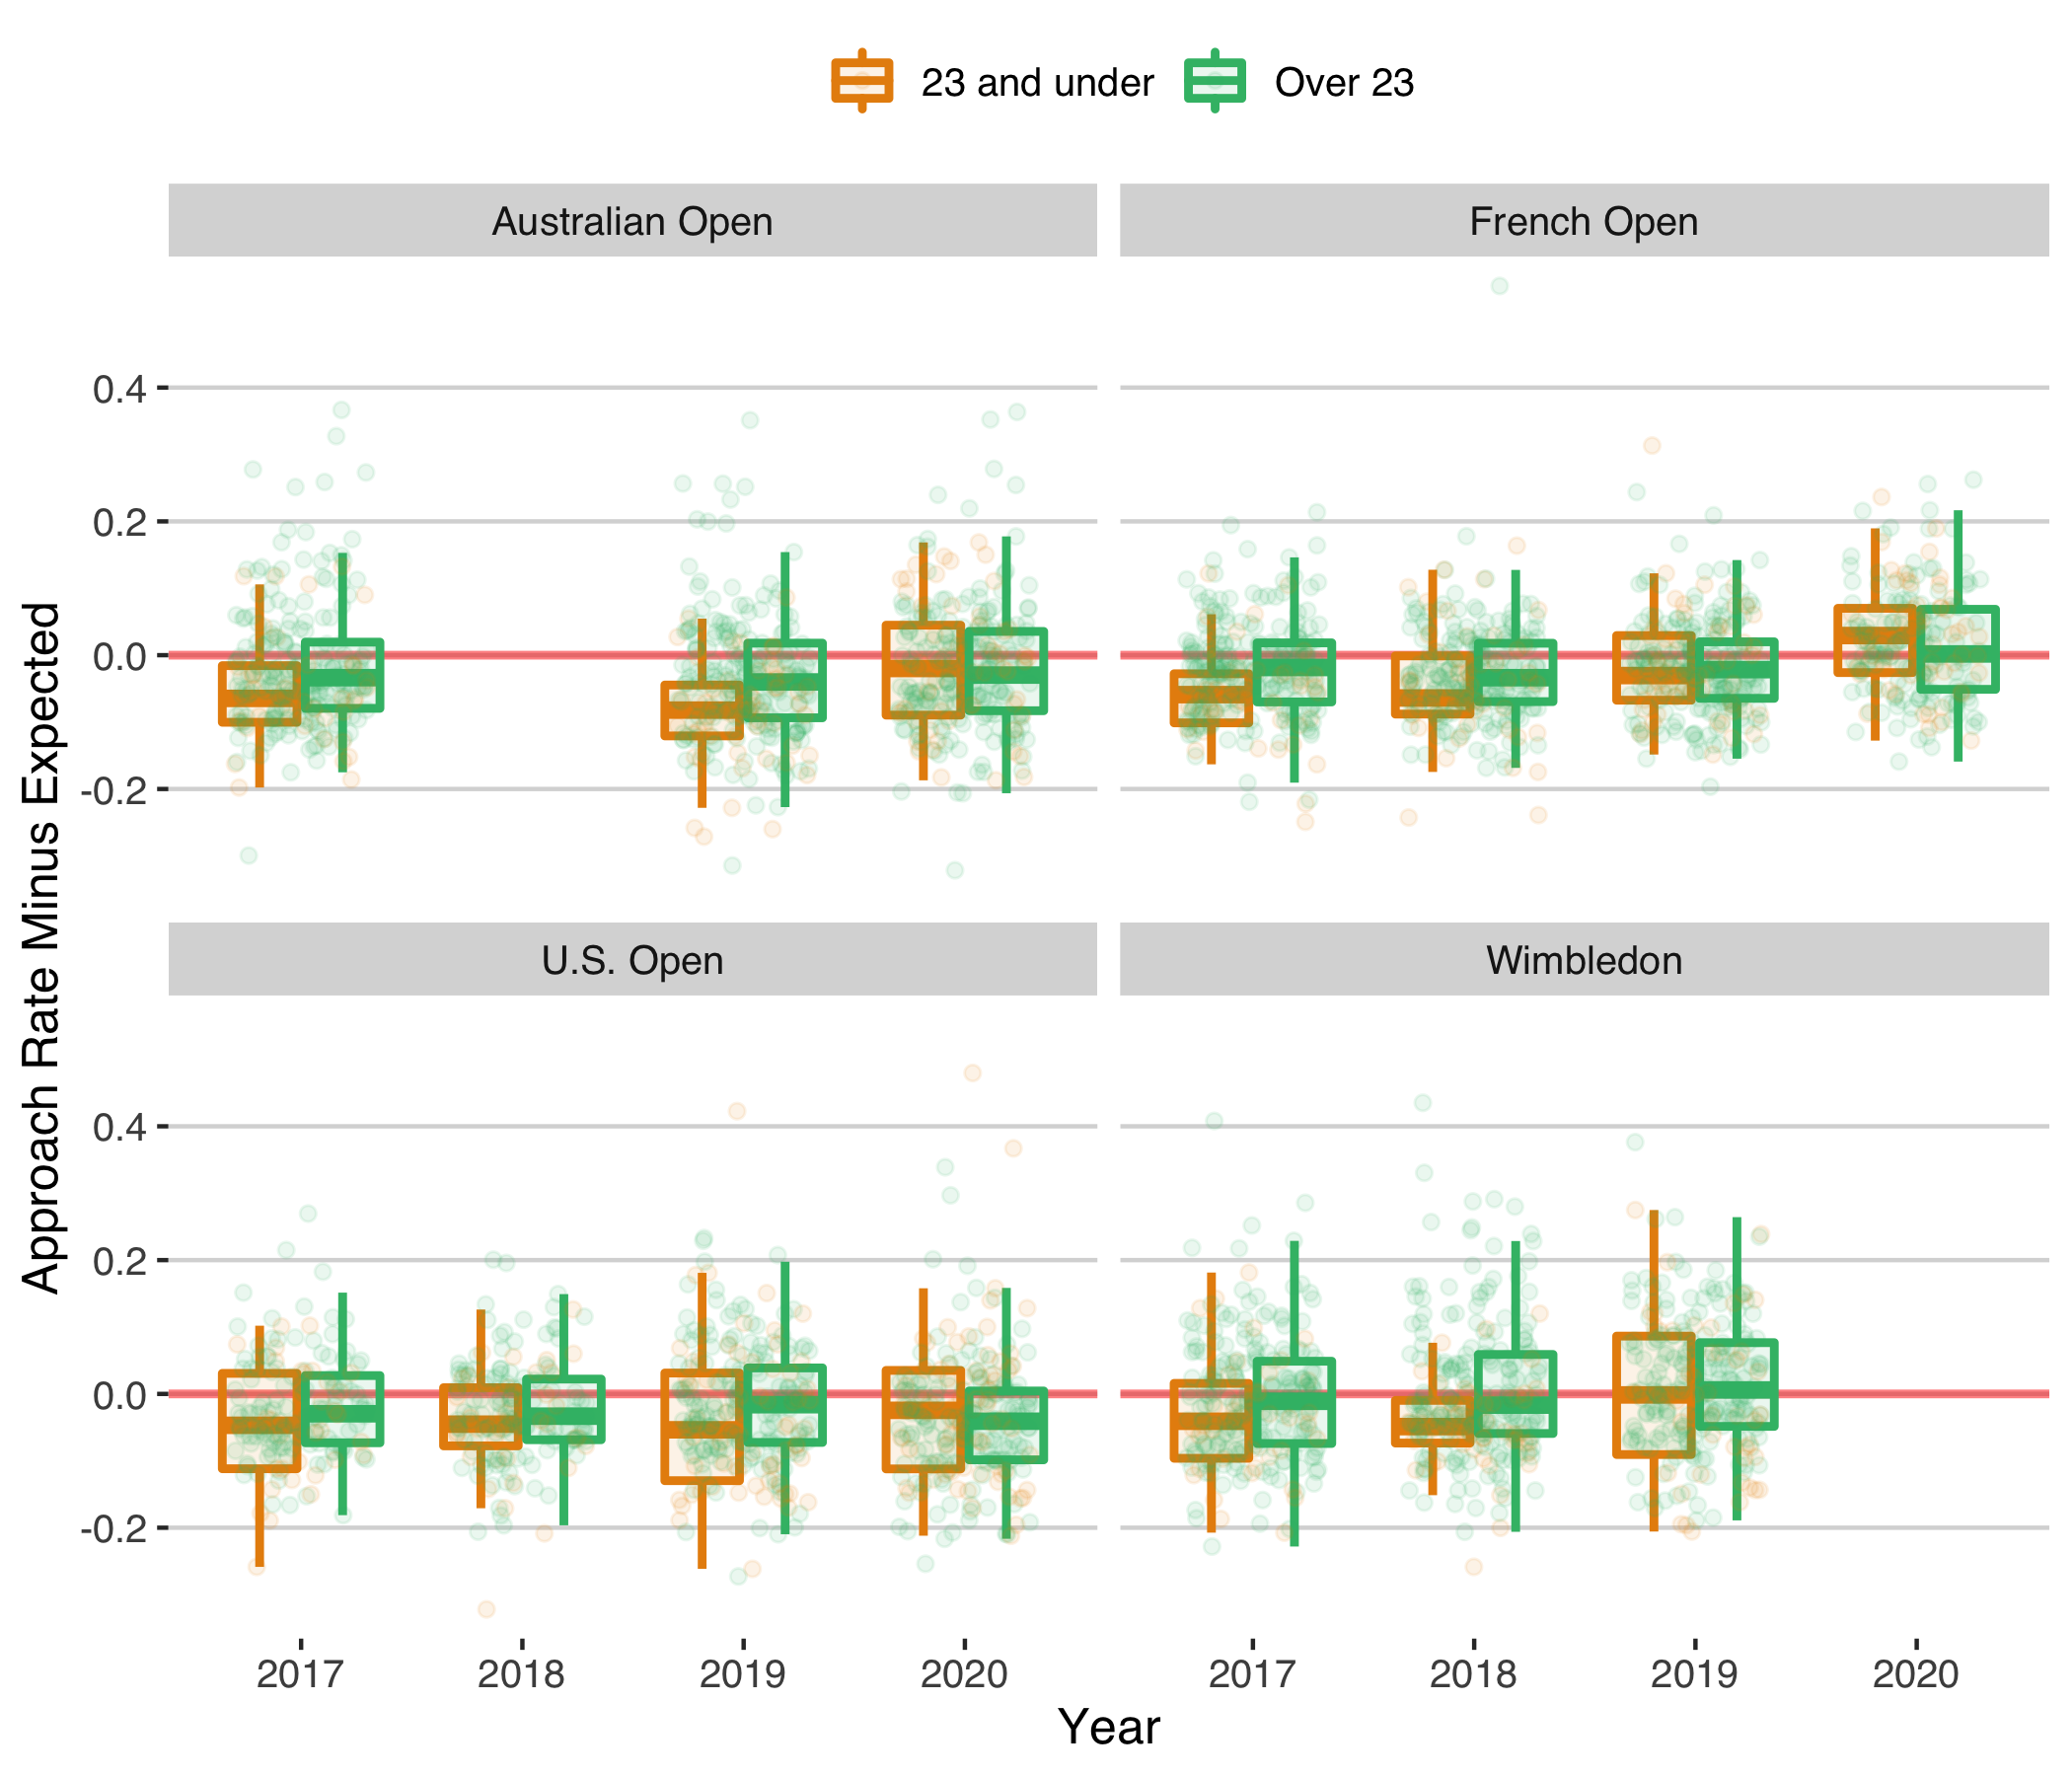
Here is the summary in the approach rate minus expected rates. You’ll notice no 2016 and no 2018 for the AO, which is owing to gaps in match stats in those years. There has been a clear upward trend in approach rates at the French Open, most starkly among the under 23s. Because we are adjusting for the factors in our approach model, this means that there is some change in the historical approach patterns at work on clay. The trends on other surfaces are less clear.
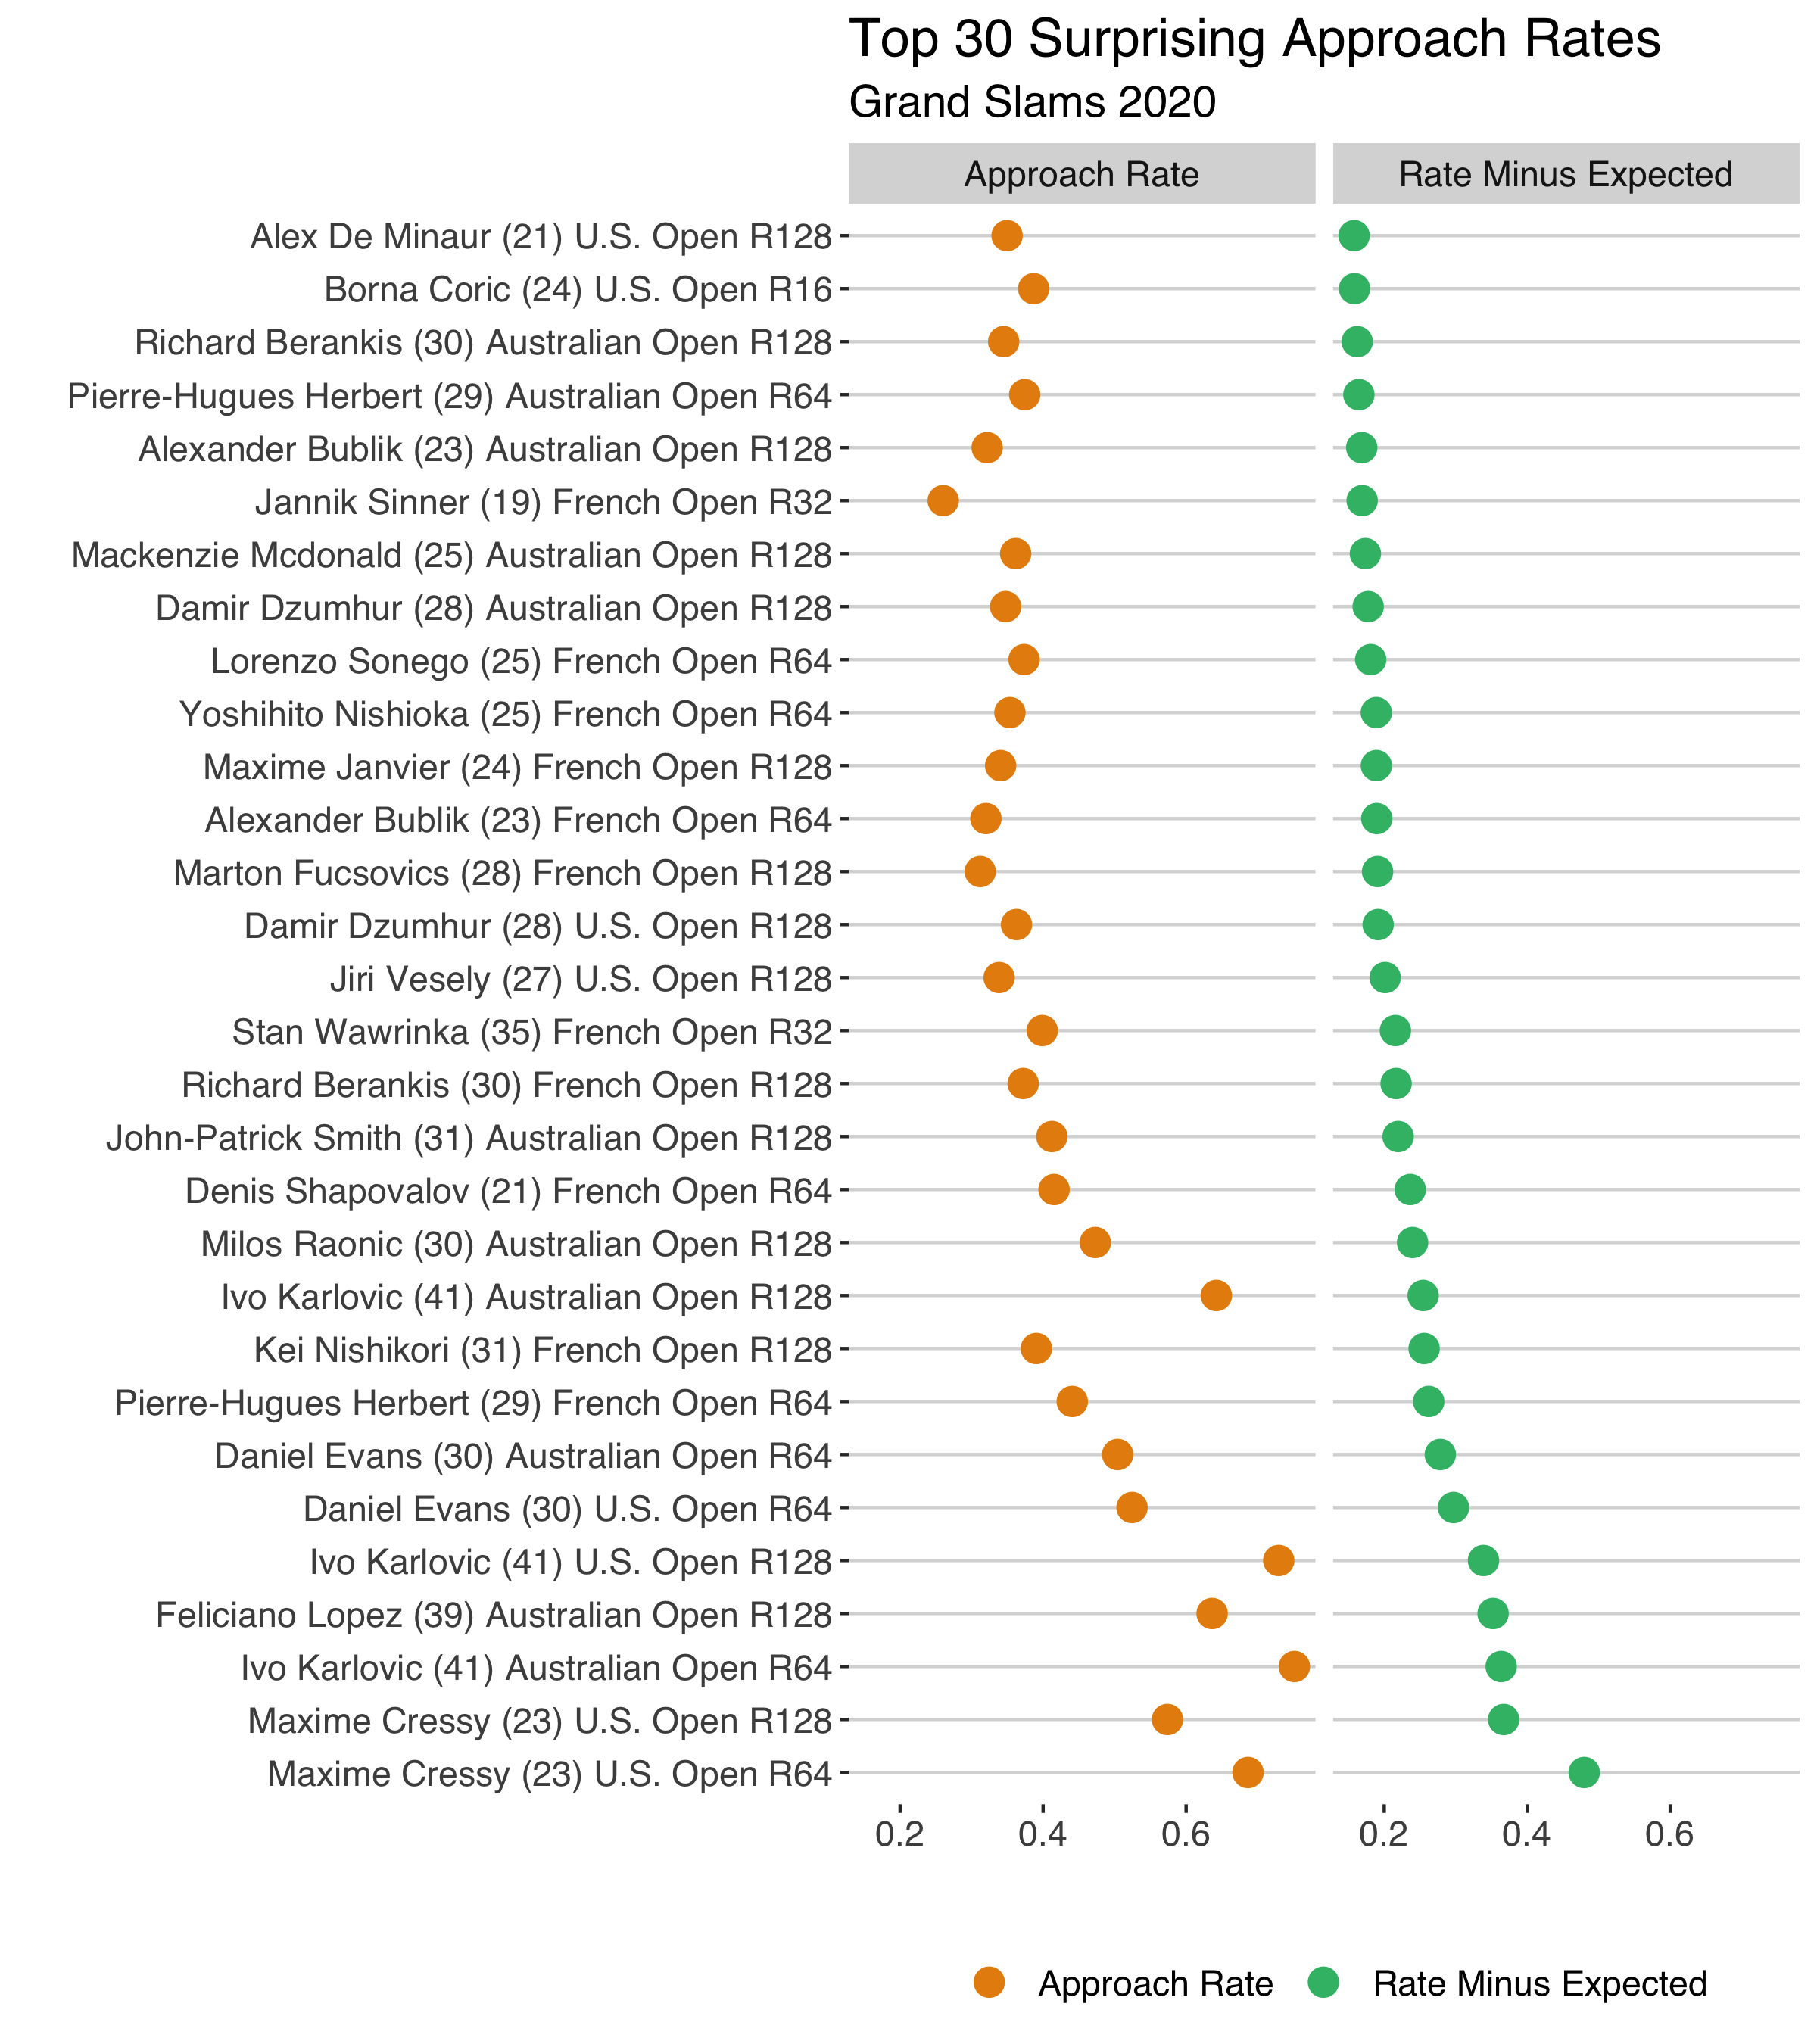
Who are contributing the most to these trends? The top 30 biggest residual performances in 2020 (below) show a mix of players who are huge and struggle at the baseline along with a log lithe, younger guys who have more of an all around game.
The increase in approach rates at Roland Garros is interesting but I think it is still too early to say if it is part of a broader trend. If the young stars keep making moves like we are seeing in the strange 2020 season, we should have plenty of opportunity to put this theory to the test.