A Spatial Exploration of Serve Patterns
Using a recently discovered source of summary tracking data for Grand Slam matches, Peter Tea explores the spatial features of top men’s and women’s serves.
Anticipating your opponent’s move is a salient skill in tennis: a skill that undoubtedly requires hours of deliberate practice to properly hone. Nowadays, with serves frequently clocked above 200 KM/H, the serve is arguably the toughest shot to anticipate. Fortunately, servers are somewhat predictable in their serve direction patterns under certain match scenarios. But which variables specifically should returners prioritize when bracing for the serve?
With a newfound — and now publicly available! — ball tracking data source from the Roland Garros 2019 and 2020 tournaments, we can dive into some neat visualizations of serve location patterns. In total, this treasure trove of data contains 82 men’s and 81 women’s singles matches, amounting to 23,588 and 14,862 available serve observations (including all first, second and faulted serves), respectively.
Serve Heatmaps
With serve bounce location data, we can naturally visualize server tendencies with 2D kernel density estimates. I present these density heatmaps below. The technical details behind the colour gradient scales are a bit tricky to interpret, but essentially darker regions represent areas with higher density of serve bounce locations. For convenience, this density was scaled, such that binned areas with the highest density are given a value of 1 (see colourbar legend)1
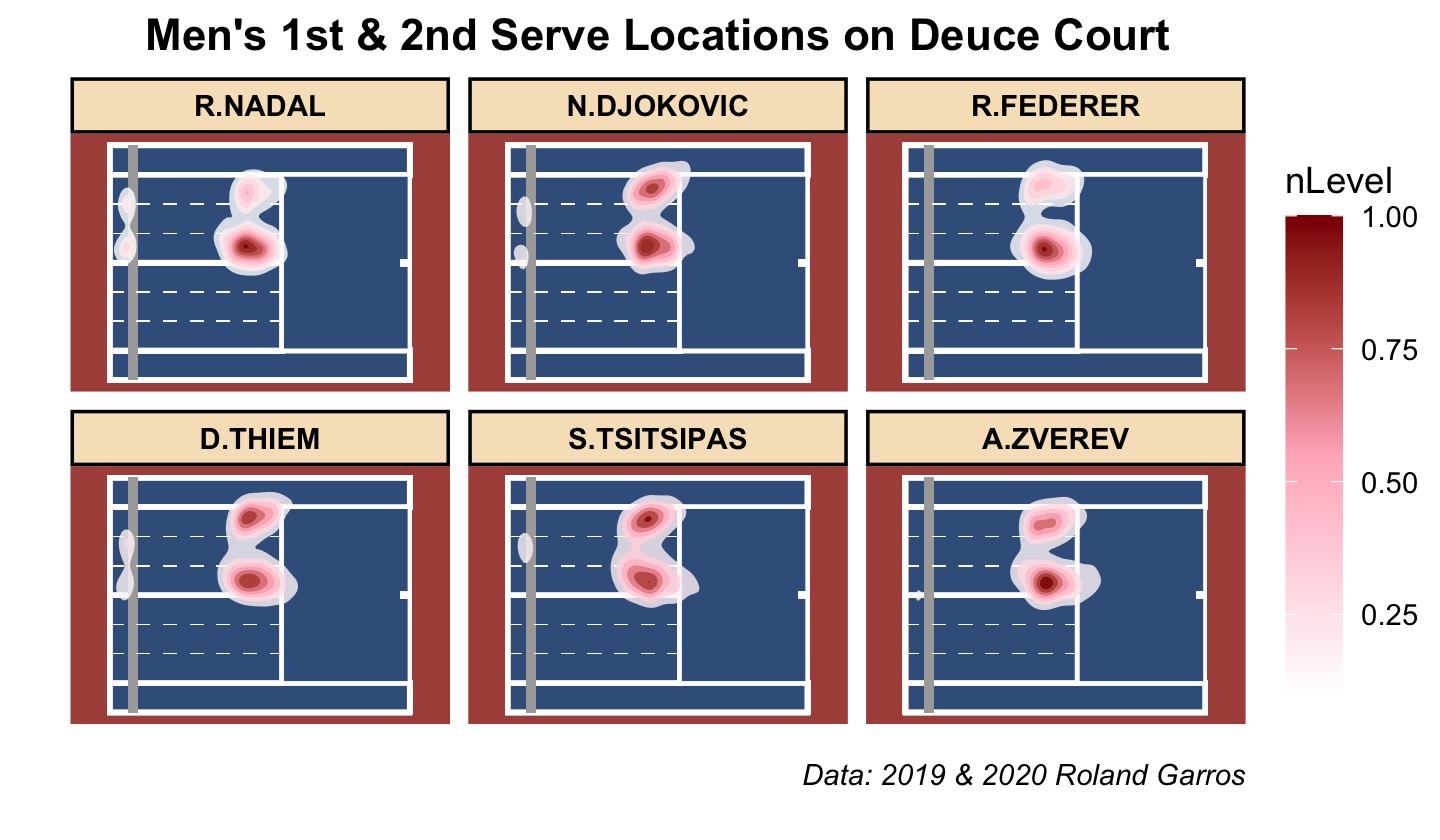
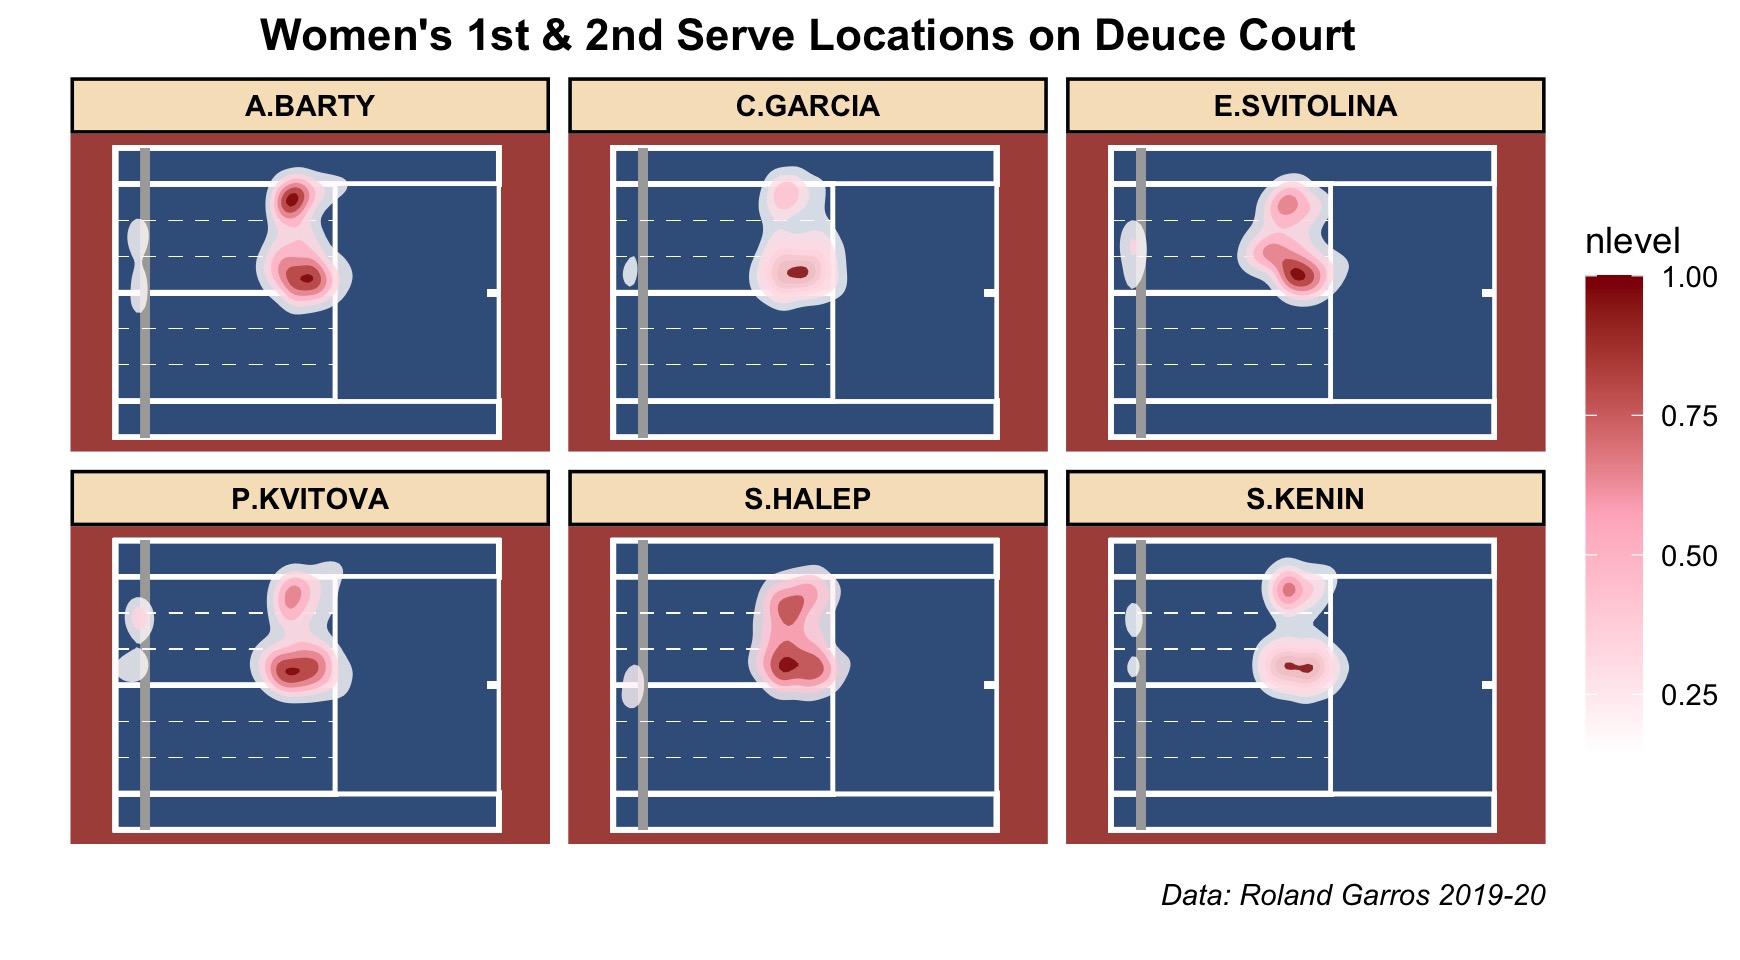
With these colourful heatmaps, we can appreciate the variability in serve location tendencies across leagues and, also, players. For example, the ATP players shown here typically aim their serves towards the corners: Wide and T. Meanwhile, the WTA players shown here have a slightly more conservative approach where their serves commonly land towards the body.
In terms of player-to-player differences, notice that both Nadal and Federer are inclined to serve down T on Deuce court; conversely, Djokovic has a higher penchant for aiming both down T and out Wide. Similar patterns do exist when considering serve locations on Advantage court — for example, lefties like Nadal love slicing out Wide — but we’ll move on and explore other interesting serve patterns. It is clear though that serve directions are server-dependent. What other factors could be in play?
Match Pressure Situations
It is a popular belief that some players have a go-to serve — a supposed bread-and-butter serve — they resort to on pressure situations like a breakpoint. Maybe this is true, but from a statistical lens, breakpoint observations are relatively scarce and so underpowered that I’ve been unable to improve any model fit with breakpoint indicators. Instead, I’ve implemented a point importance feature — a proxy for match pressure — that calculates a player’s expected change in match win probability, depending on if they win or lose the current point. Initially proposed by Carl Morris, and popularized by Kovalchik (2016)2, point importance is a numeric feature mapped onto [0,1]. With point importance, we can include match situations, besides breakpoints, that have a sizable impact on match outcome — eg: serving when down 15 - 30 in the 5th set also represents a tense moment.
So that’s cool, but how exactly does point importance relate to serve direction? Let’s take a look at a Federer case-study. The heatmaps below represent Federer’s combined first and second serve locations on important, and less important points.
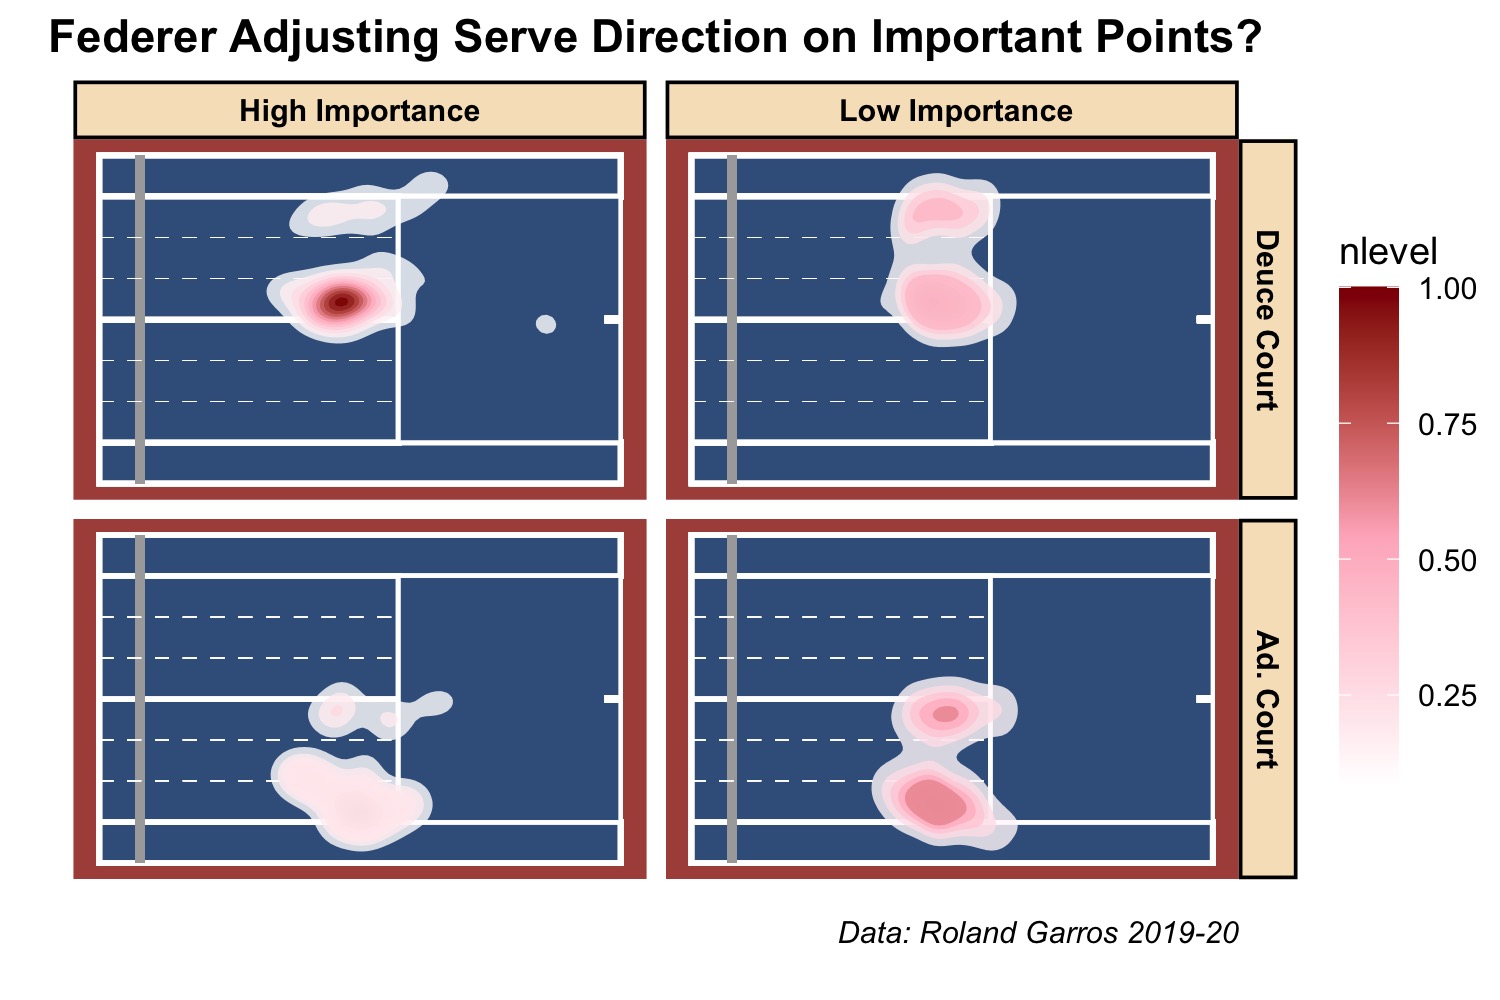
For convenience, I’ve arbitrarily binned point importance such that all points above the 80th quantile are High Importance, while all other points are Low Importance; this binning amounts to 113 High Importance points and 442 Low Importance points. Notice that on important points, Federer loves the serve down T on Deuce Court, and arguably opts for more Wide/Body serves on Ad. Court; by stark contrast, Federer is much less predictable on his Low Importance points.
This of course is just a sliver of point importance’s impact on serve direction. For other players — Djokovic, for example — there is no apparent change in serve direction behaviour based solely on point importance.
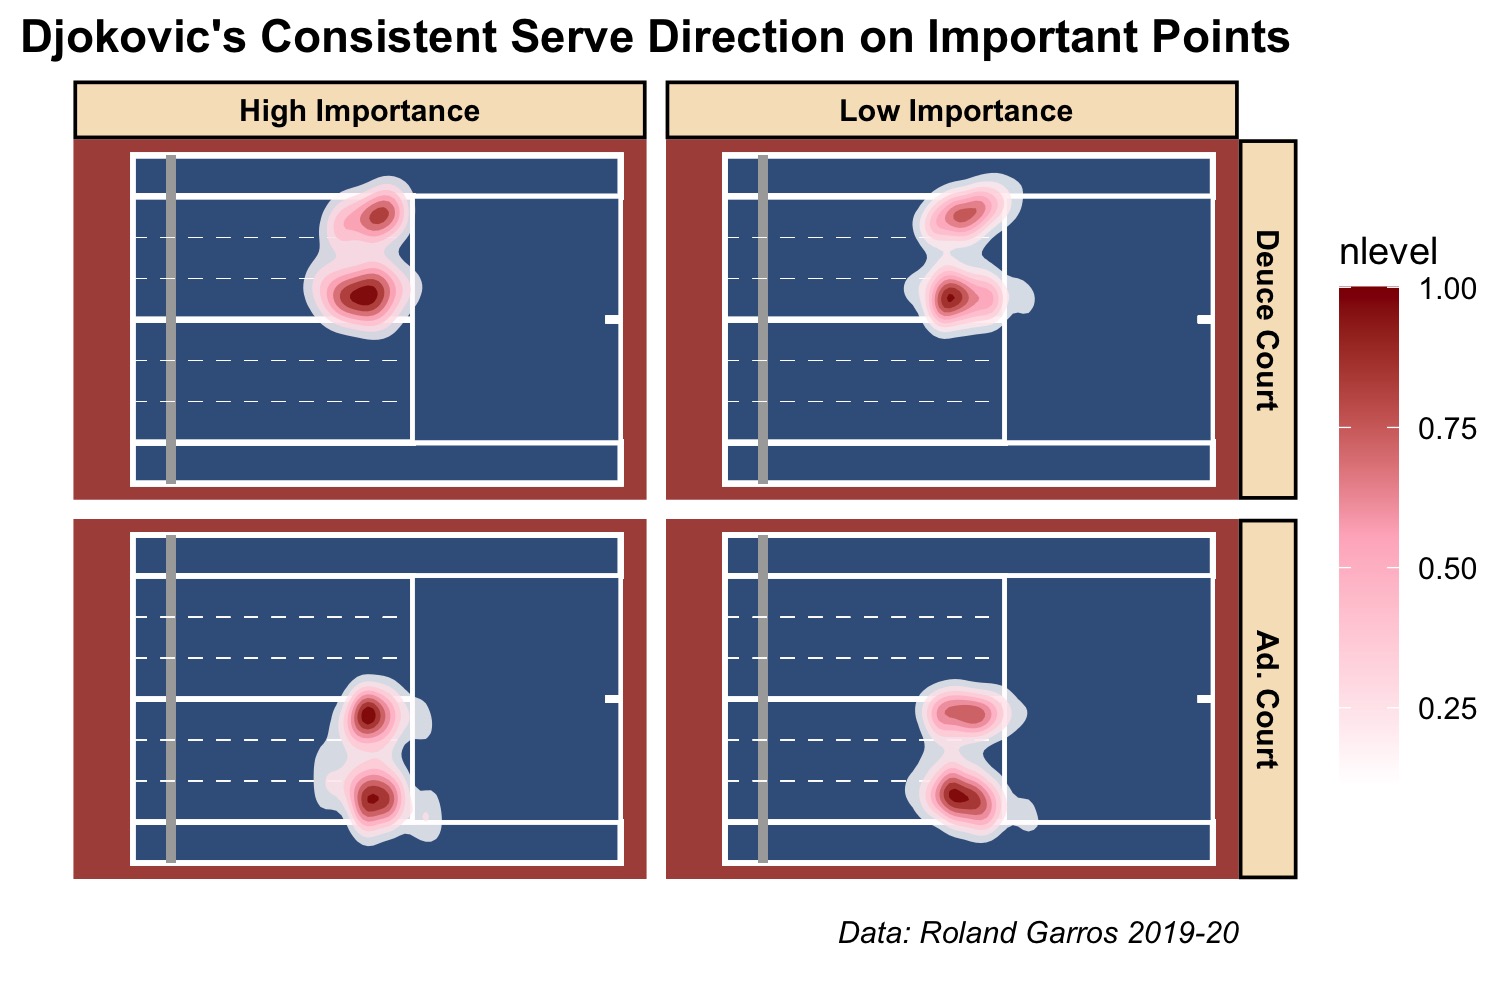
I admit being a novice in game theory, but there may be some mixed strategy implications here with Djokovic seemingly more willing to randomise his serve direction options; at least, more so than Federer.
You might suspect that point importance is opponent-dependent. That is, a player is more likely to face strenuous match situations against more elite competition. And depending on the level of competition faced between these two players, we might not exactly be getting an apples-to-apples comparison. While this may, to some degree, be true, on average I’ve found the levels of point importance to be reasonably comparable.
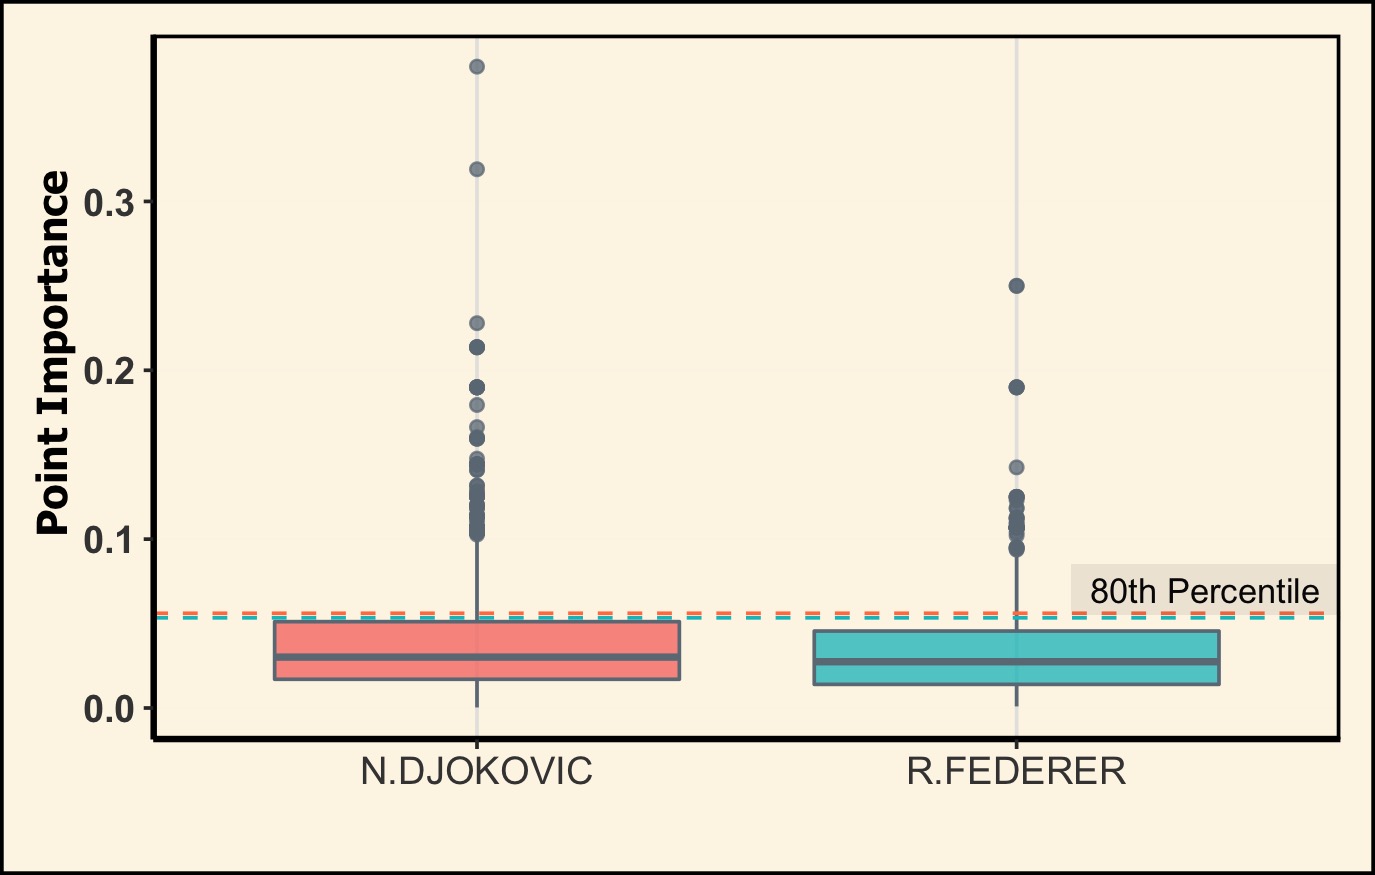
Take for example Djokovic' and Federer’s boxplots of point importance, and notice that they are quite similar.
Handedness of Server and Returner
Loffing et.al (2017)3 suggest that right- and left-handed servers have different serve location tendencies; these differences are further compounded when accounting for the returner’s handedness. Tactically speaking, it is a common tactic to deliberately target your opponent’s weakness — which is usually their backhand. With our ball-tracking data set, we see that ATP players do typically target the returner’s backhand on second serve.
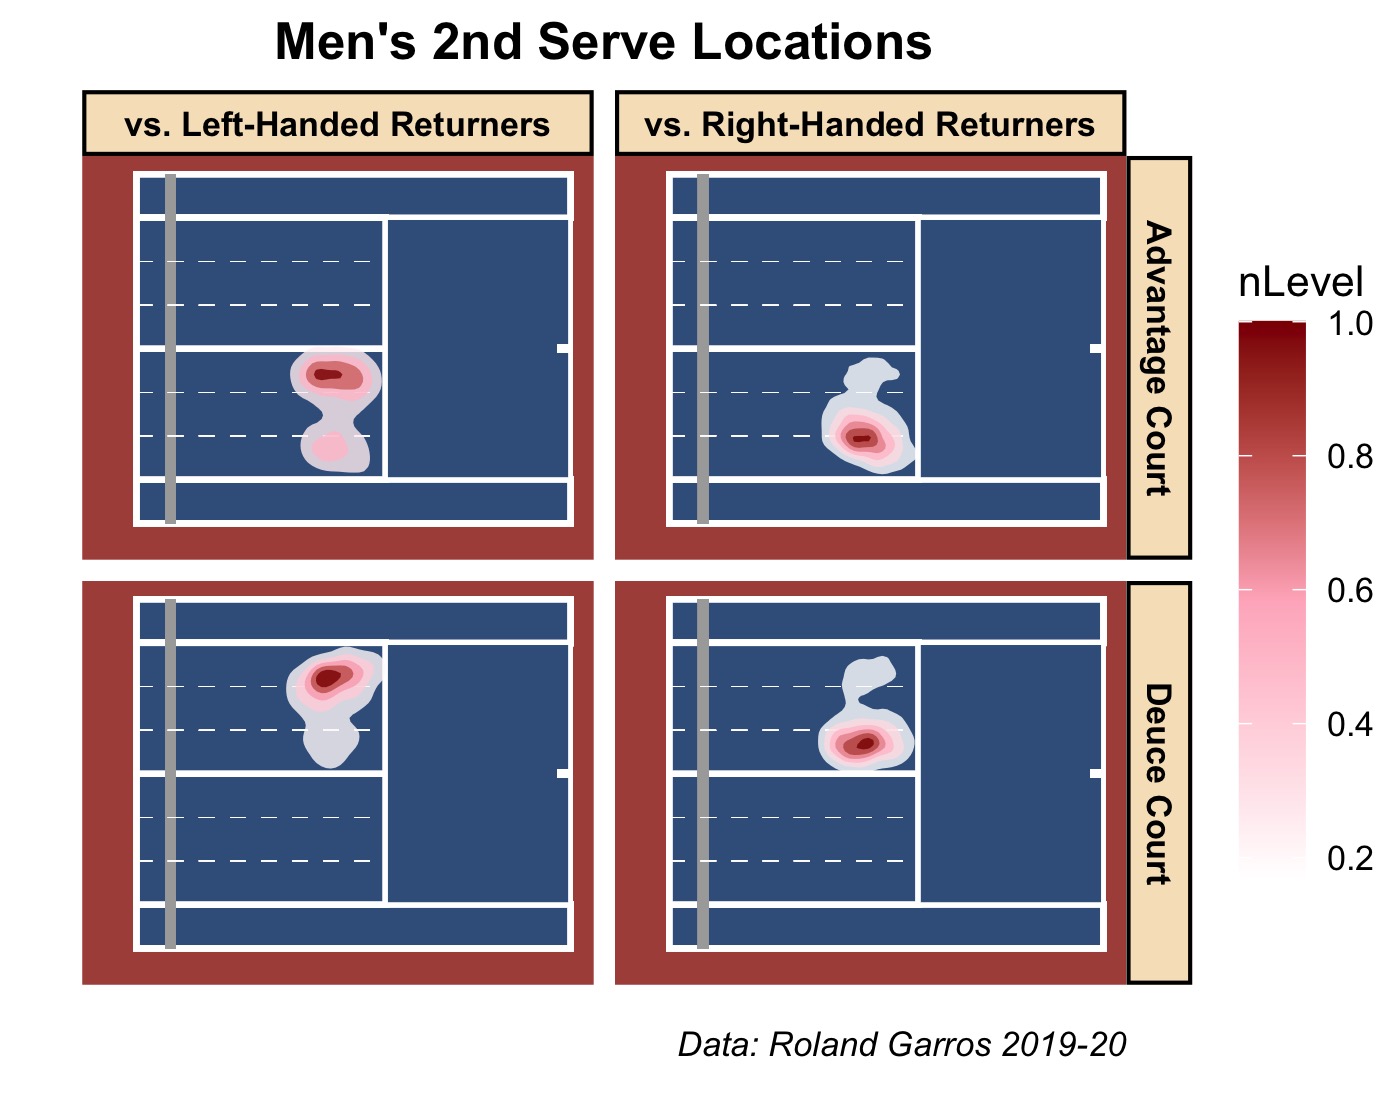
While not shown here, players don’t have as obvious a serve pattern on their first serve compared to their second.
You may be skeptical of the generalizability of left-handed ATP players in this sample, given the sheer dominance of Nadal on clay this past decade. Indeed, most points against left-handers in our data are against Nadal. But, do players serve with the same, general tactic against lefties as they do when facing Nadal?
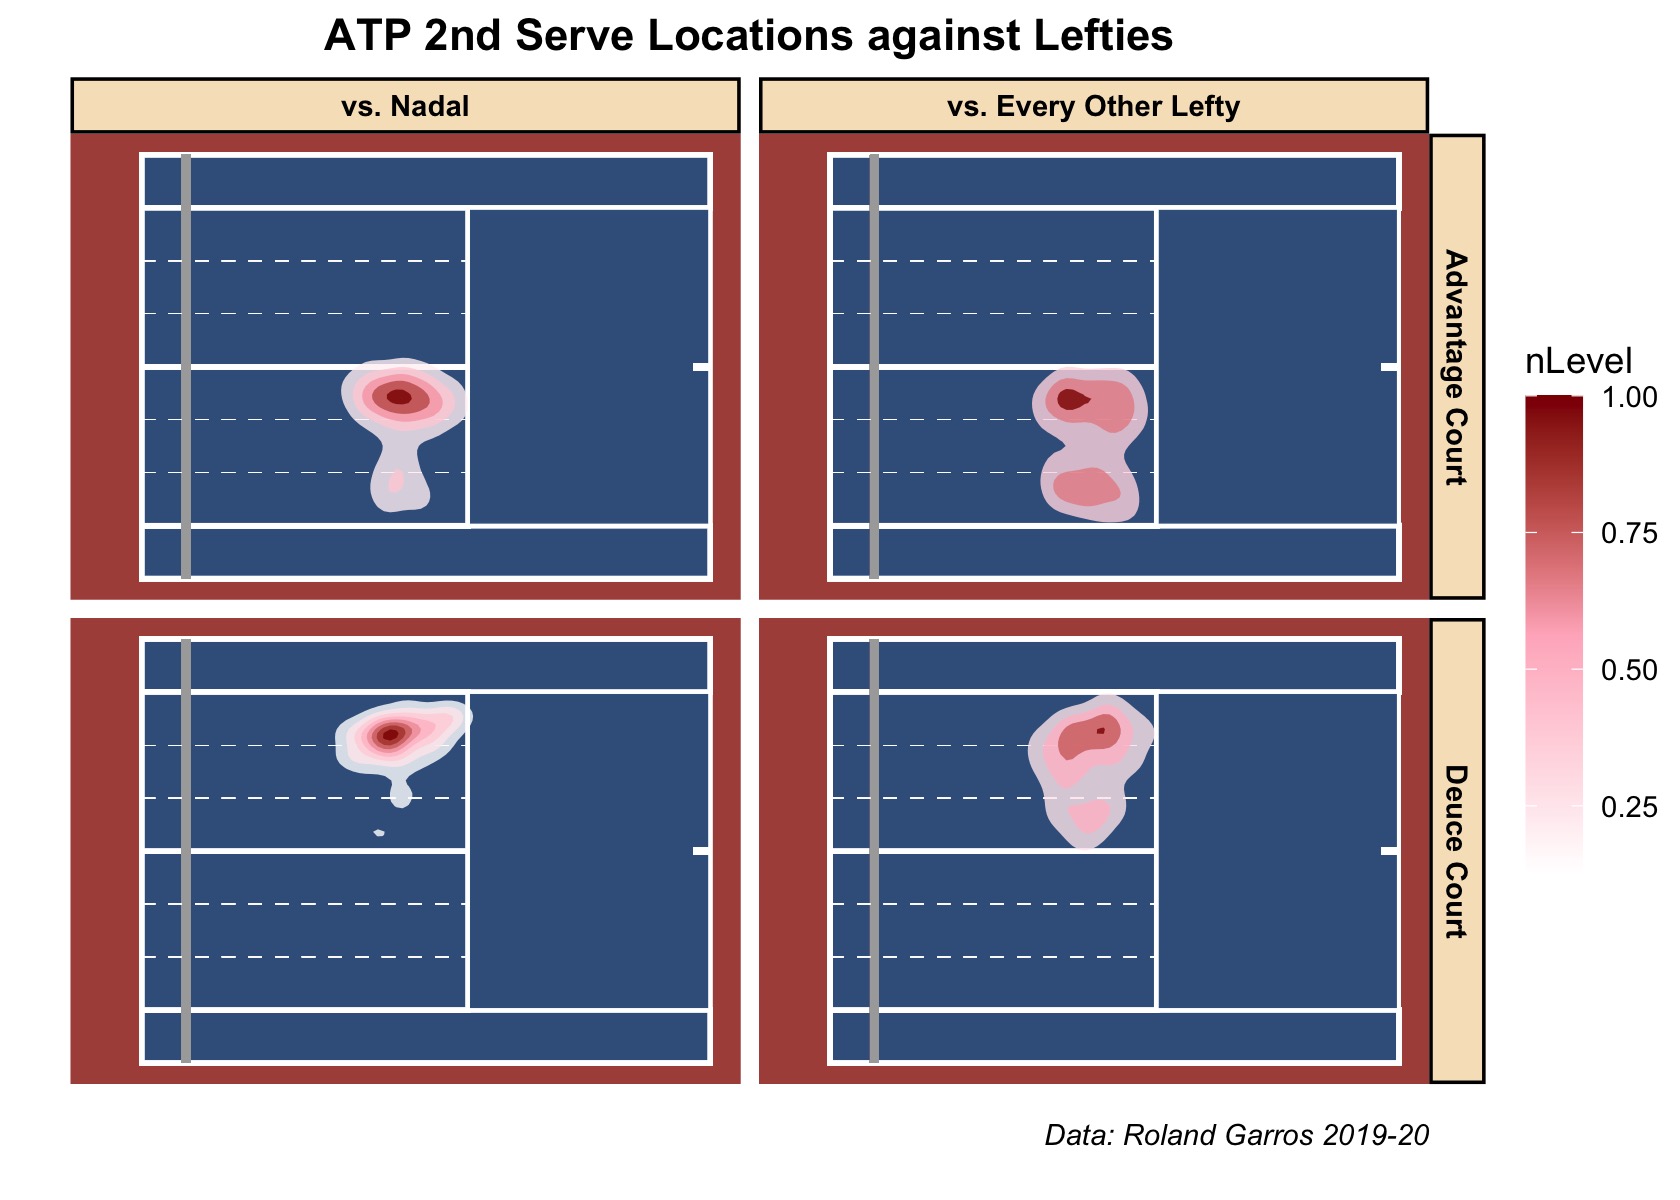
The above plot suggests not. Against every other lefty not named Rafa, players will serve second serves to their forehand and backhand. This observation is in stark contrast when compared to Nadal, where players routinely target the Spaniard’s backhand. Perhaps this has to do with lefties being a rare breed on tour, relative to their righty counterparts. Adjustments are difficult to make if you are accustomed to playing against similar handedness opponents. Interestingly, these second serve patterns are not unique to the ATP.
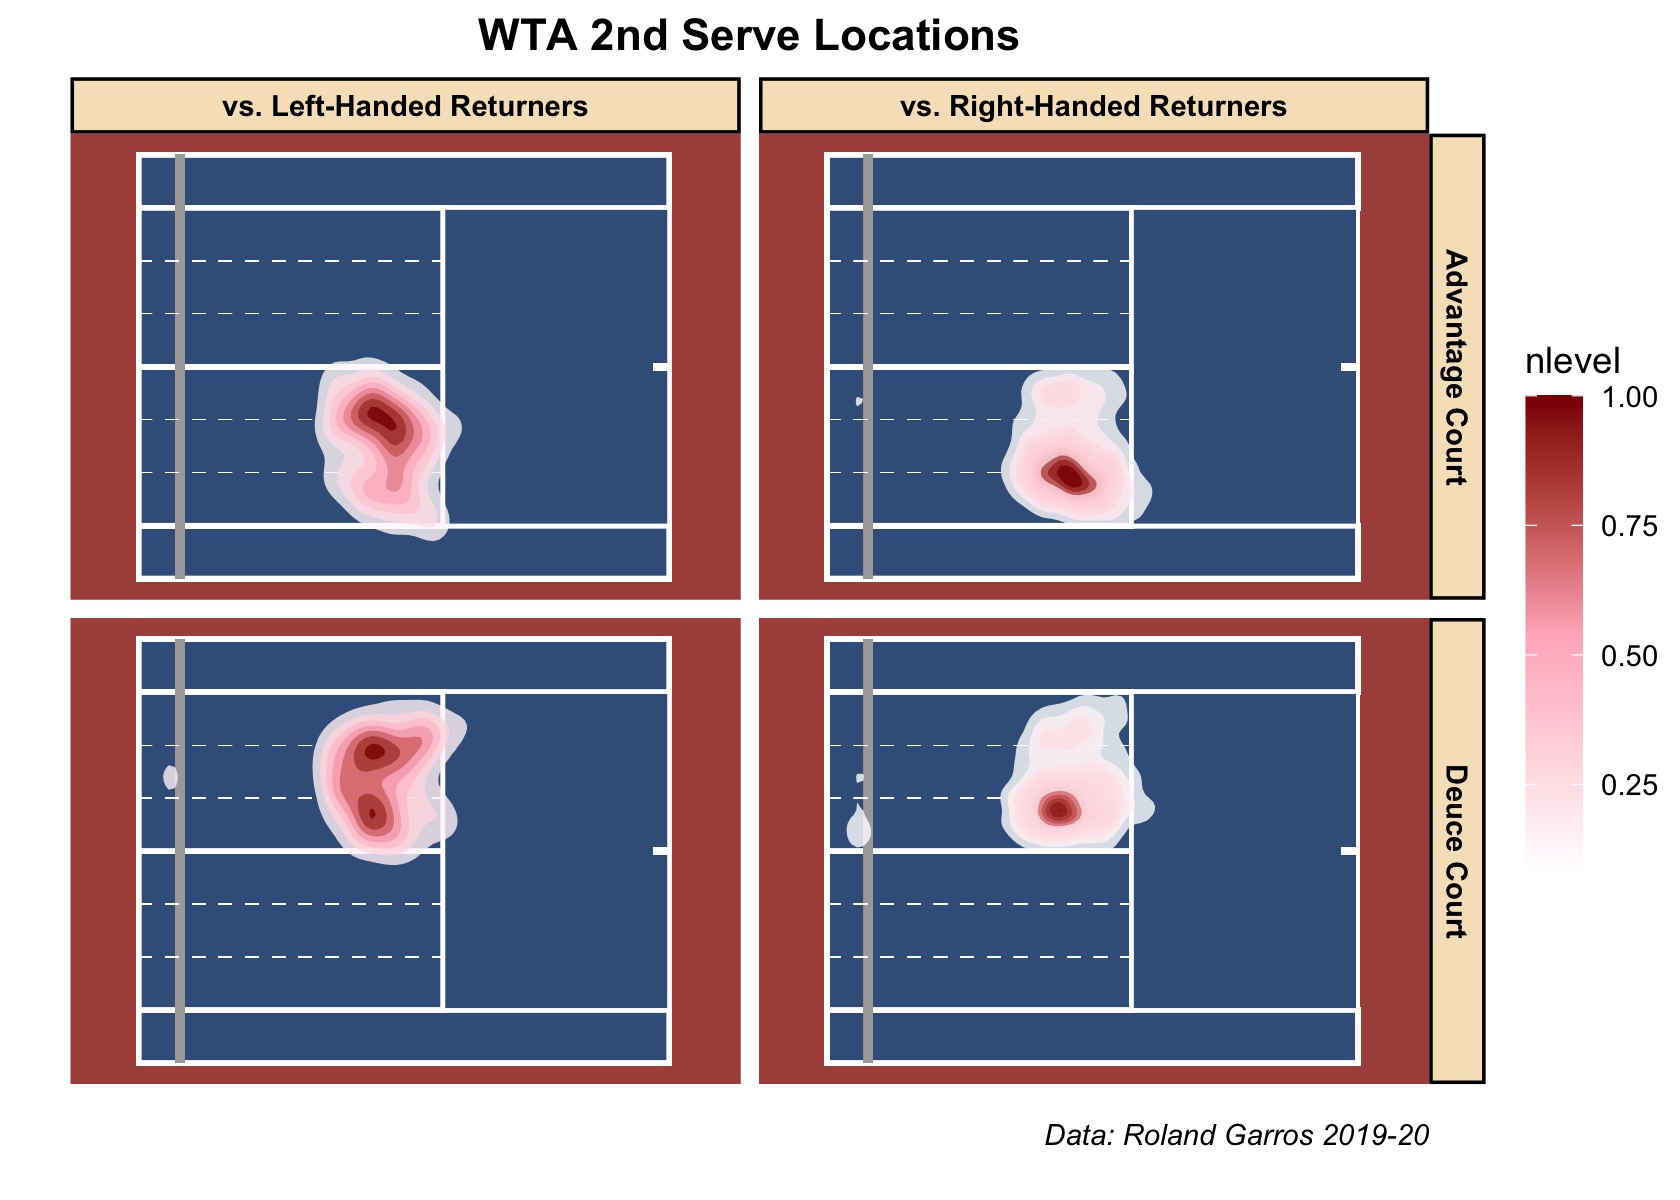
Again we see that when facing righties, WTA servers unmistakably target the backhand. But against lefties, there isn’t a clear, dominating strategy: serves are targeted towards both forehand and backhand!
While we’re still only just scratching the surface, there’s a lot of insight left to be gleaned from the availability of rich tracking data. Much of tennis analytics has, historically, lamented the sparsely available tracking data. Here’s hoping that the enlightenment period in tennis analytics is now kicking off.
-
Admittedly, these heatmaps are sensitive to how you bin areas. For instance, the ATP heatmaps might suggest that Rafa has more net-faults than Zverev, which isn’t the case. ↩︎
-
See http://on-the-t.com/2015/12/27/quantifying-clutch-performance/ ↩︎
-
Loffing, F., Hagemann, N., & Strauss, B. (2009). The serve in professional men’s tennis: Effects of players’ handedness. International Journal of Performance Analysis in Sport, 9(2), 255-274. ↩︎